Cost of invoice errors: the real number and the FTE math
Published on :
August 17, 2026

Nicolas Marchais is co-founder and CEO of Phacet. After seven years at Spendesk, he built Phacet as the agentic layer that orchestrates across ERP, banking and email systems. Reliable, auditable, cross-system, what he calls a Finance Workforce.

An invoice error is a discrepancy between what a supplier billed and what was ordered, delivered or contractually agreed, and it costs a company twice: once in the work needed to resolve it, and once in the money that leaves the business when it is never resolved at all.
Published benchmarks will not give you your number. They range from 0.8% to 39%, they contradict each other, and the formula most often used to turn them into a cost is arithmetically wrong. What follows is a model you can run on your own volumes, and a way to express the answer in the only unit a finance team really arbitrates in.
Key takeaways
- Published invoice error rates run from 0.8% to 39%, a spread of a factor of 49, so no external benchmark can stand in for your own measurement.
- An invoice error carries two separate costs: the rework a finance team can see, and the overpayment that leaves without anyone noticing.
- Multiplying total supplier spend by an error rate overstates leakage by an order of magnitude, because frequency and severity are two different variables.
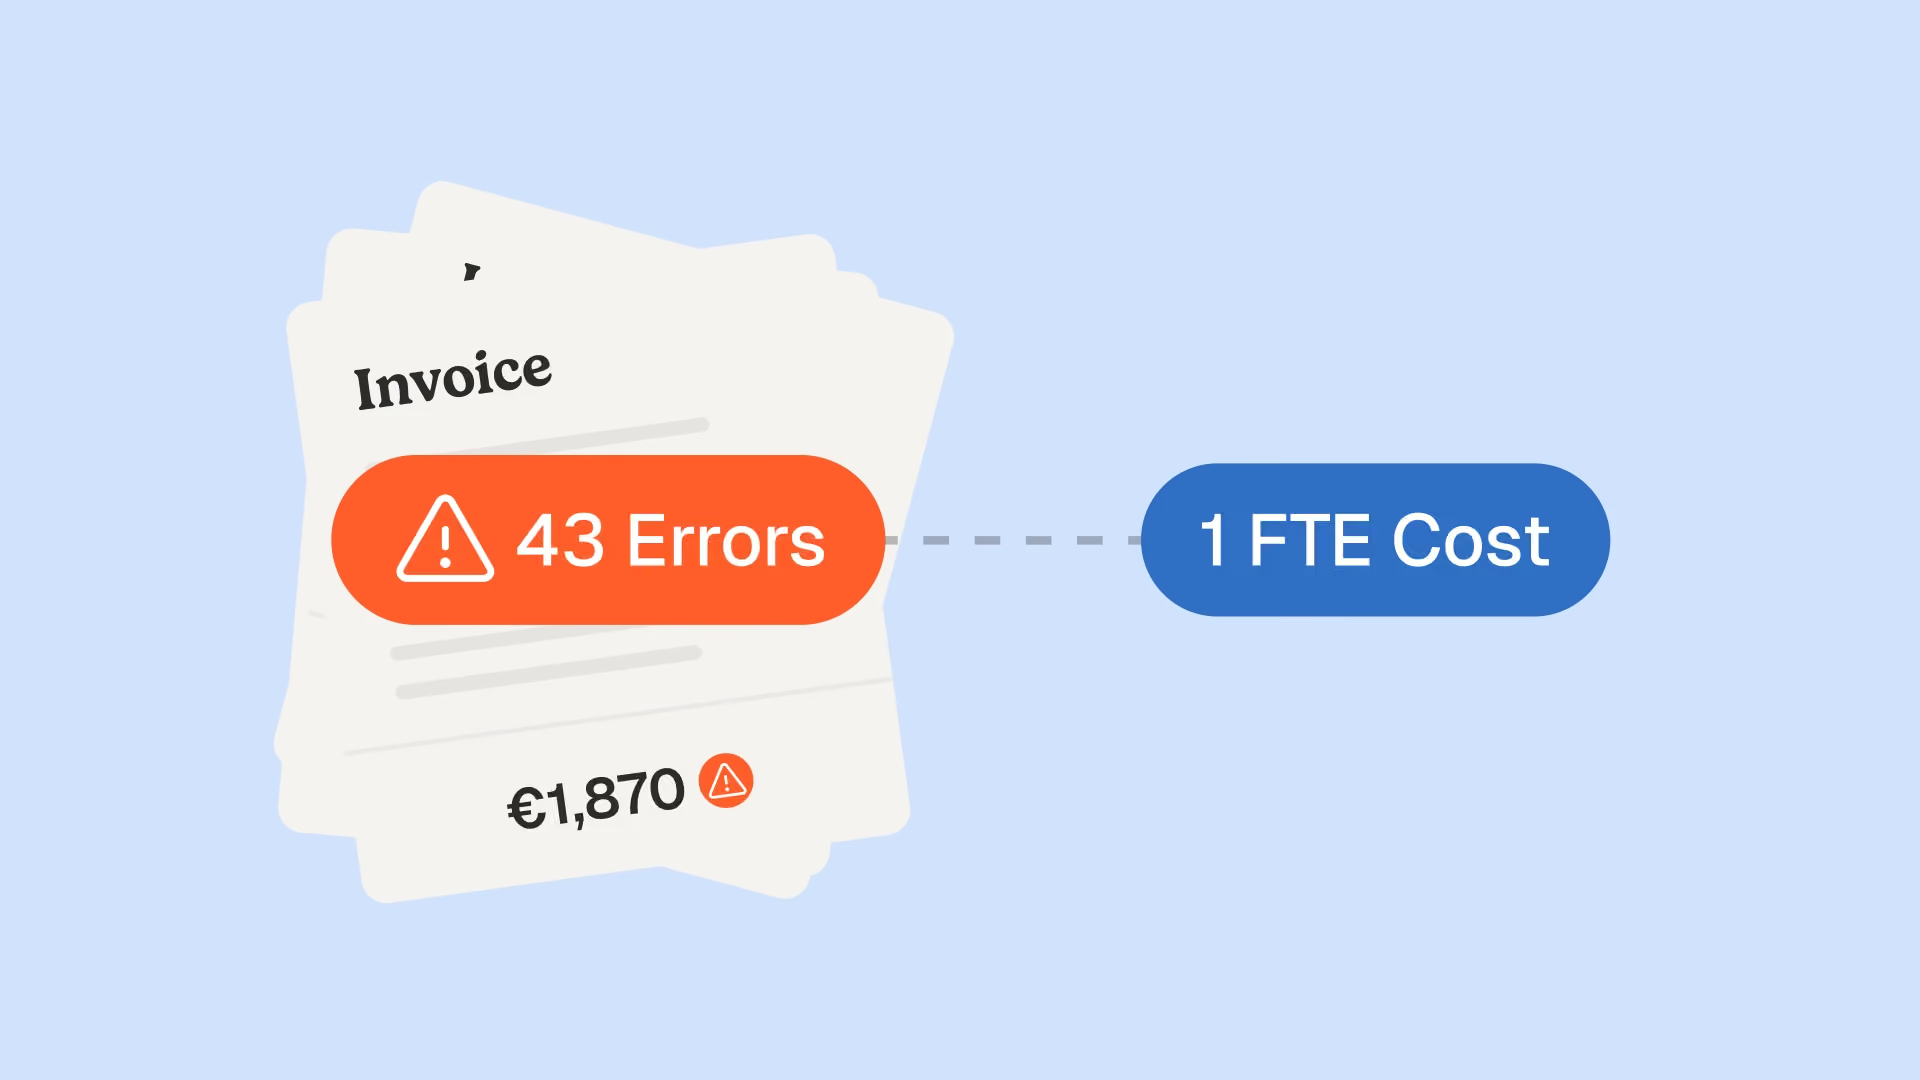
- At 16,800 invoices a year, checking every line by hand costs roughly 0.70 FTE, which is more than the leakage that checking recovers.
Every published invoice error rate contradicts the next
There is no shortage of statistics on invoice errors. There is simply no agreement between them. Depending on which page you land on, the share of invoices carrying an error is 0.8%, 1.6%, 5%, 5% to 8%, 6.7%, 22%, 33% or 39%. The highest figure is forty-nine times the lowest, and all of them are presented as industry data.
| Figure | What it is said to measure | Where it appears | Source credited |
|---|---|---|---|
| 0.8% | Error rate reached by top performers | Medius, October 2025 | Its own benchmark |
| 1.6% | Error rate of manual data entry | Symtrax, March 2025 | Sterling Commerce |
| 5% or less | The "acceptable" industry standard | Medius, October 2025 | None stated |
| 5% to 8% | Freight invoices with billable errors | Nuvocargo, April 2026 | "Studies", unnamed |
| 6.7% | Invoices containing some form of error, quoted as 1 in 15 | CPRS | Its own estimate |
| 22% | Freight invoices needing manual correction | Laneproof, 2026 | "IOFM 2025" |
| 33% | Supplier statements carrying a discrepancy, quoted as 1 in 3 | FISCAL Technologies, December 2025 | "Industry research", unnamed |
| 39% | Invoices that contain an error | FISCAL Technologies, KeyMark, and others | IOFM in some articles, DocuClipper in others |
| 39% | Share of errors AP teams actually detect, the opposite claim | Resolve Pay | A Qvalia infographic |
| $53 | Cost of resolving one invoice error | Symtrax, March 2025 | IOFM |
| $53.50 | Cost of rectifying one paper invoice error | Ottimate | Sterling Commerce |
Two problems sit inside that table. The first is that the same 39% is published with two opposite meanings. Several sources use it for the share of invoices containing an error. Resolve Pay uses it for the share of errors that accounts payable teams manage to detect, which is a completely different quantity, and does so in one article while stating the first version in another.
The second problem is the sourcing chain. The 53 dollar cost of resolving one error is credited to the Institute of Finance and Management by some publishers and to Sterling Commerce by others. Sterling Commerce has not existed as an independent company since IBM completed its acquisition on 27 August 2010, so a 2026 article citing a Sterling Commerce study is citing an entity that was absorbed sixteen years ago. Meanwhile the Qvalia infographic given as the origin of the 39% detection figure publishes no number at all on its public page: the data sits behind a download form.
None of this means the underlying research does not exist. It means the published record is not usable as a benchmark, and that borrowing a number from it tells you nothing about your own accounts payable function.
An invoice error costs you twice
Most articles on this subject count one cost. There are two, they behave differently, and they are almost never added correctly.
The visible cost: rework on every exception you catch
This is the cost your team feels. Someone notices a mismatch, pulls the purchase order, calls the site to check what was actually delivered, emails the supplier, waits for a credit note, and re-enters the corrected line. It consumes staff hours, it is measurable, and it appears in every software vendor pitch because it is the easy half.
It is also the smaller half, and it has a perverse property: you only pay it on the errors you find. A team that checks nothing has a rework cost of zero. That does not make it a well-run team.
The invisible cost: what leaves and never comes back
This is the money paid out on an error nobody caught. A unit price two percent above the contracted rate. A duplicate invoice settled twice. A rebate earned and never applied. A quantity billed above what the delivery note shows.
Unlike rework, this cost is silent. Nothing in your financial systems flags it, the supplier has no incentive to raise it, and by the time a recovery audit finds it, part of the amount is beyond the point of claim. At Astotel, a group of eighteen Paris hotels, a Phacet agent surfaced roughly 400 euros of billing errors per month on a single supplier, close to 5,000 euros a year. On one supplier account, out of many.
Why the most common formula gives the wrong answer
A formula circulates widely for turning an error rate into an annual cost. It multiplies total supplier spend by the estimated error rate, then adds the labour hours. It looks reasonable and it is badly wrong.
Multiplying spend by an error rate treats every euro on an erroneous invoice as lost. It is not. An invoice with a mispriced line is still overwhelmingly correct: the loss is the overcharge, not the invoice. Frequency and severity are two independent variables and they must be measured separately.
Take 13.1 million euros of annual supplier spend and a 4% error rate. The circulating formula returns 524,160 euros of annual error cost. Compute it properly, with 672 erroneous invoices carrying an average overcharge of 46 euros, and the leakage is roughly 18,500 euros. The formula overstates the real number by a factor of 28.
That gap matters in both directions. It produces business cases no CFO will believe, inflates the value of duplicate payments recovered, and once the inflated number is challenged, it discredits a problem that is genuinely worth solving.
Where the errors actually sit
Not all errors behave the same way. Some generate rework, some generate leakage, some generate both, and the ones that matter most share a property: they are invisible on the invoice itself. You cannot detect a price above the contracted rate by reading the invoice. You need the price list. You cannot detect an over-delivery without the goods receipt.
| Error type | Creates rework | Creates leakage | Visible on the invoice alone |
|---|---|---|---|
| Unit price above the contracted rate | No if never caught | Yes, recurring on every future line | No, needs the price list |
| Duplicate invoice | Yes, supplier claim and credit note | Yes, full invoice value | No, needs payment history |
| Quantity billed above the delivery note | Yes, dispute with the site | Yes, the difference | No, needs the goods receipt |
| Credit note or rebate never applied | No | Yes, money already owed to you | No, needs the supplier account |
| Charge outside contract terms, surcharges and accessorials | Yes, contract check | Yes, per occurrence | No, needs the contract |
| Wrong tax rate | Yes, correction and refiling | Partial, recoverable | Yes |
| Wrong cost centre or GL coding | Yes, reallocation at close | No, distorts reporting instead | Yes |
| Missing legal or reference information | Yes, reissue request | No | Yes |
This is why price validation and 3-way matching, which compares the order, the delivery note and the invoice, catch a different population of errors than a visual review does. A visual review finds the missing reference number. It never finds the supplier price variance that has been repeating quietly for eight months.
A model you can run on your own numbers
Six variables are enough. Invoice volume, average invoice value, error frequency, average overcharge per error, minutes to check one invoice, minutes to resolve one exception. Everything else follows.
Consider a mid-sized group processing 1,400 supplier invoices a month across its sites, on 13.1 million euros of annual spend.
| Step | Calculation | Result |
|---|---|---|
| Invoice volume | 1,400 supplier invoices per month | 16,800 per year |
| Supplier spend | 16,800 invoices at an average of 780 euros | 13.1 million euros |
| Error frequency | 4% of invoices carry at least one anomaly | 672 errors per year |
| Error severity | 46 euros of overcharge on the average erroneous invoice | Value at stake per error |
| Detection effort | 4 minutes to check one invoice against the price list, the order and the delivery note | 1,120 hours per year |
| Resolution effort | 12 minutes to resolve each of the 672 exceptions | 134 hours per year |
| Total control workload | 1,120 plus 134 hours, against 1,800 productive hours per year | 0.70 FTE |
| Cost of that workload | 1,254 hours at a loaded rate of 38 euros | 47,667 euros per year |
| Leakage it recovers | 60% of errors reach payment under sampling, 403 errors at 46 euros | 18,538 euros per year |
| Verdict | Manual control at 100% coverage costs more than it recovers | Negative by 29,129 euros |
The 4% frequency and the 46 euro overcharge used above are placeholders, not measurements. They are also the two figures worth stress-testing first, because they are the ones you cannot borrow. Frequency you can measure in a fortnight by checking one hundred invoices properly against the price list and the delivery notes, and counting. Severity you get from the same exercise, by recording the value of each discrepancy rather than just its existence. Those two numbers are worth more than every benchmark quoted in this article.
What the result looks like in FTE
Convert the hours and the picture changes. Checking 16,800 invoices at four minutes each is 1,120 hours a year. Resolving 672 exceptions at twelve minutes each adds 134. Against 1,800 productive hours a year, full manual control on this volume costs 0.70 FTE, or about 47,700 euros of loaded salary.
It recovers around 18,500 euros. Manual control at full coverage loses money by roughly 29,000 euros a year, and this is the finding that explains everything else. It is why finance teams sample. Sampling is not laziness, it is a rational response to a control that costs more than it returns. The trouble is that the leak stays open, and the errors that hide in the unchecked portion are not randomly distributed, as the case against invoice sampling sets out.
The equation only inverts when the checking hours collapse. Remove the 1,120 hours of comparison and leave the 134 hours of exception handling, and the same 18,500 euros is recovered for roughly 5,100 euros of work. At La Nouvelle Garde, ten brasseries, the finance team recovered two days a week and deferred planned hires. At Astotel, the Purchasing Director gained two hours a day. "I spot errors I would never have seen on my own." That is the same arithmetic, seen from inside a team.
Control before payment, not recovery after
Recovery audits work. They also arrive late, return a fraction of what left, and charge a share of what they find. The cheaper version of the same job is to check before the payment run rather than after.
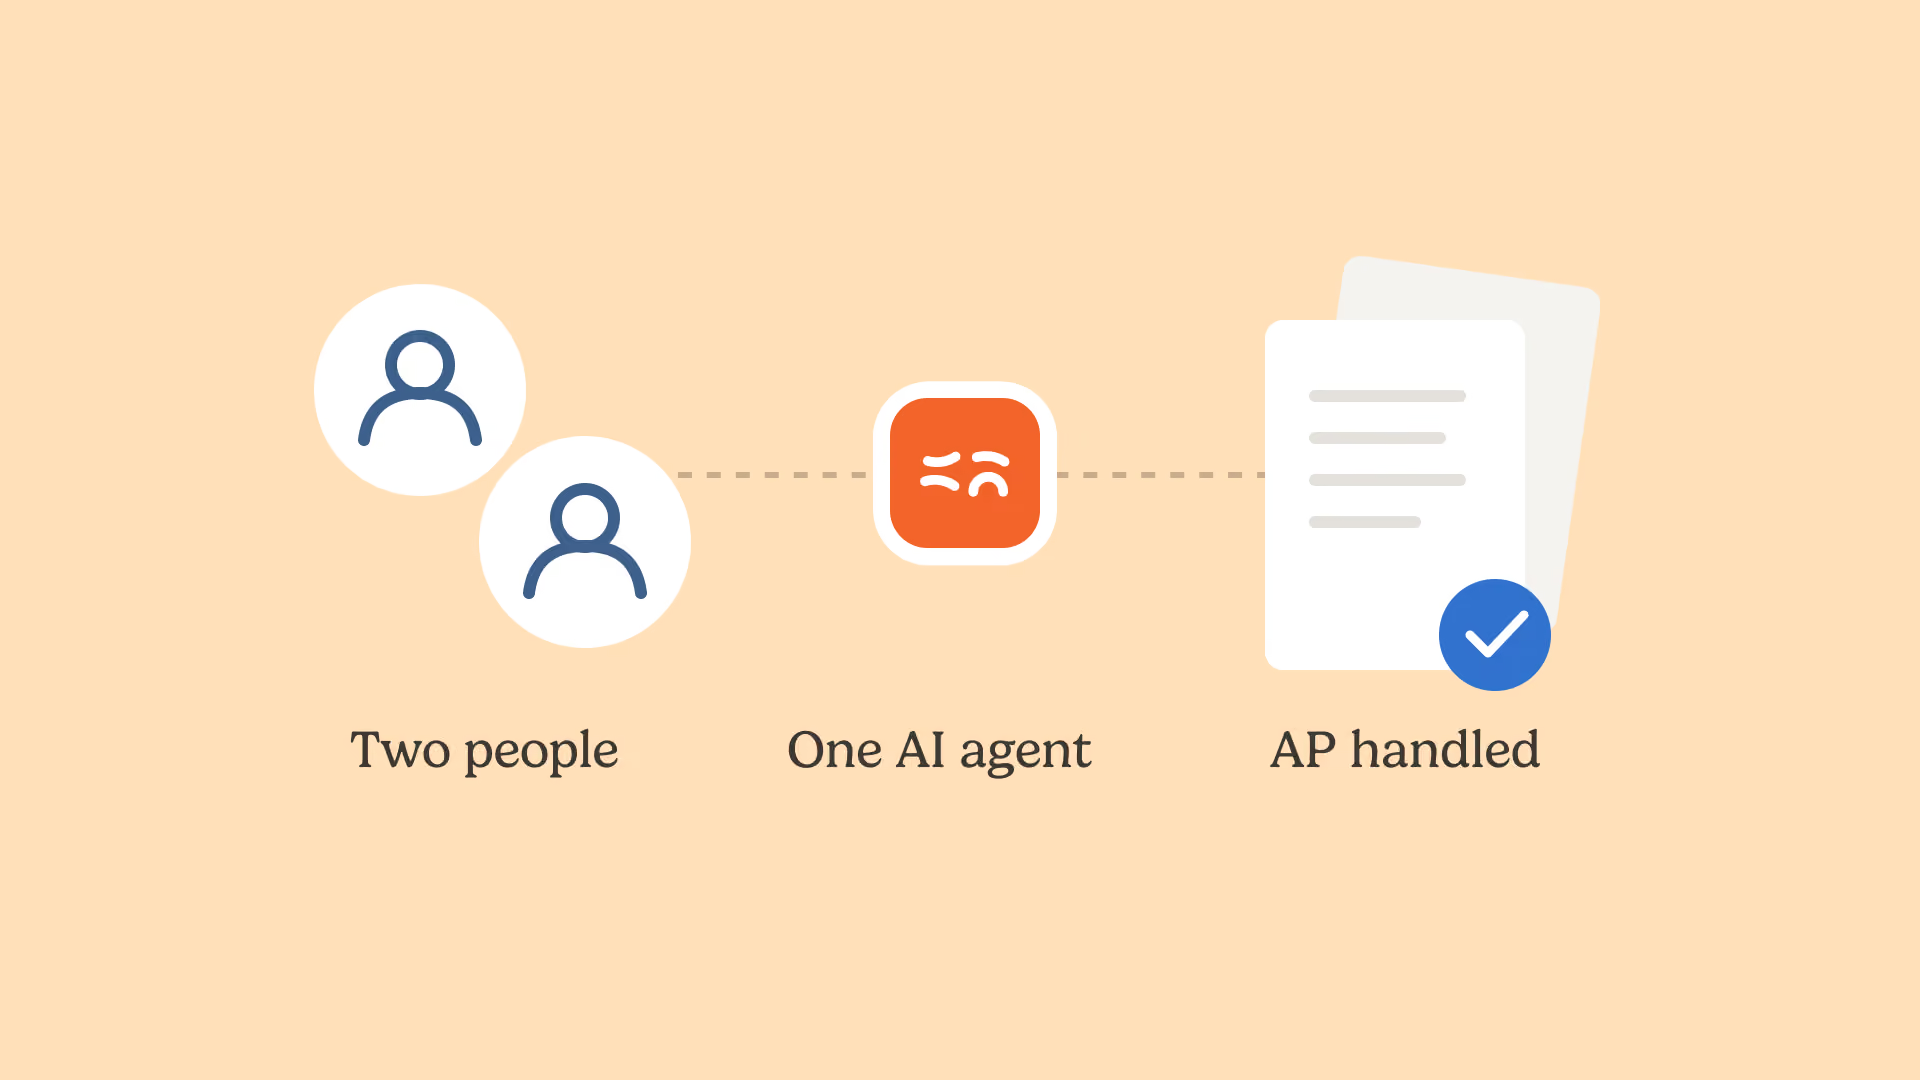
Phacet approaches this with specialised AI agents rather than a platform to configure. An agent structures each incoming invoice into an auditable table, matches it line by line against the price list, the order and the delivery note, and surfaces only what fails. The supplier billing control agent and the pre-payment validation agent both run this way, with a native audit trail so every decision is showable to an auditor or an accountant.
The team does not disappear from the process. It stops doing the comparison and keeps the judgement, which is the part it was hired for. That is what controlling before payment changes: not the headcount, the content of the work. Plans start at 299 euros a month, and a first agent is typically in production in under two weeks.
Frequently asked questions
What happens if an invoice is incorrect?
An incorrect supplier invoice should be blocked before payment, not corrected after it. The standard route is to flag the discrepancy, request a credit note or a corrected invoice from the supplier, and hold the line from the payment run. Once paid, recovery depends on the supplier's cooperation and rarely returns the full amount.
What is a red flag in an invoice?
The strongest red flags are a unit price above the contracted rate, a quantity above the delivery note, a duplicate reference against payment history, a new bank account for an existing supplier, and charges outside contract terms. Most are invisible on the invoice alone and only appear when it is compared against another document.
What are the most common supplier invoice errors?
Price drift against the agreed rate, duplicate invoices, quantity mismatches against goods receipts, unapplied credit notes and rebates, incorrect tax rates, and wrong cost centre coding. The first four cause real cash leakage. The last two mainly distort reporting and the month-end close.
What do you do if you find a billing discrepancy in an invoice?
Document the discrepancy against its supporting evidence, the order, the delivery note or the price list, before contacting the supplier. Raise it in writing, hold payment on the disputed line rather than the whole invoice where terms allow, and record the outcome so the same supplier pattern can be detected next month. Phacet agents log each step automatically.
Latest Resources
Unlock your AI potential
Go further with your financial workflows — with AI built around your needs.