

For the finance lead holding a vendor quote and trying to work out whether their own invoice volume justifies it. If you are researching automation as a concept, or writing a paper about it, the arithmetic below will not help you.
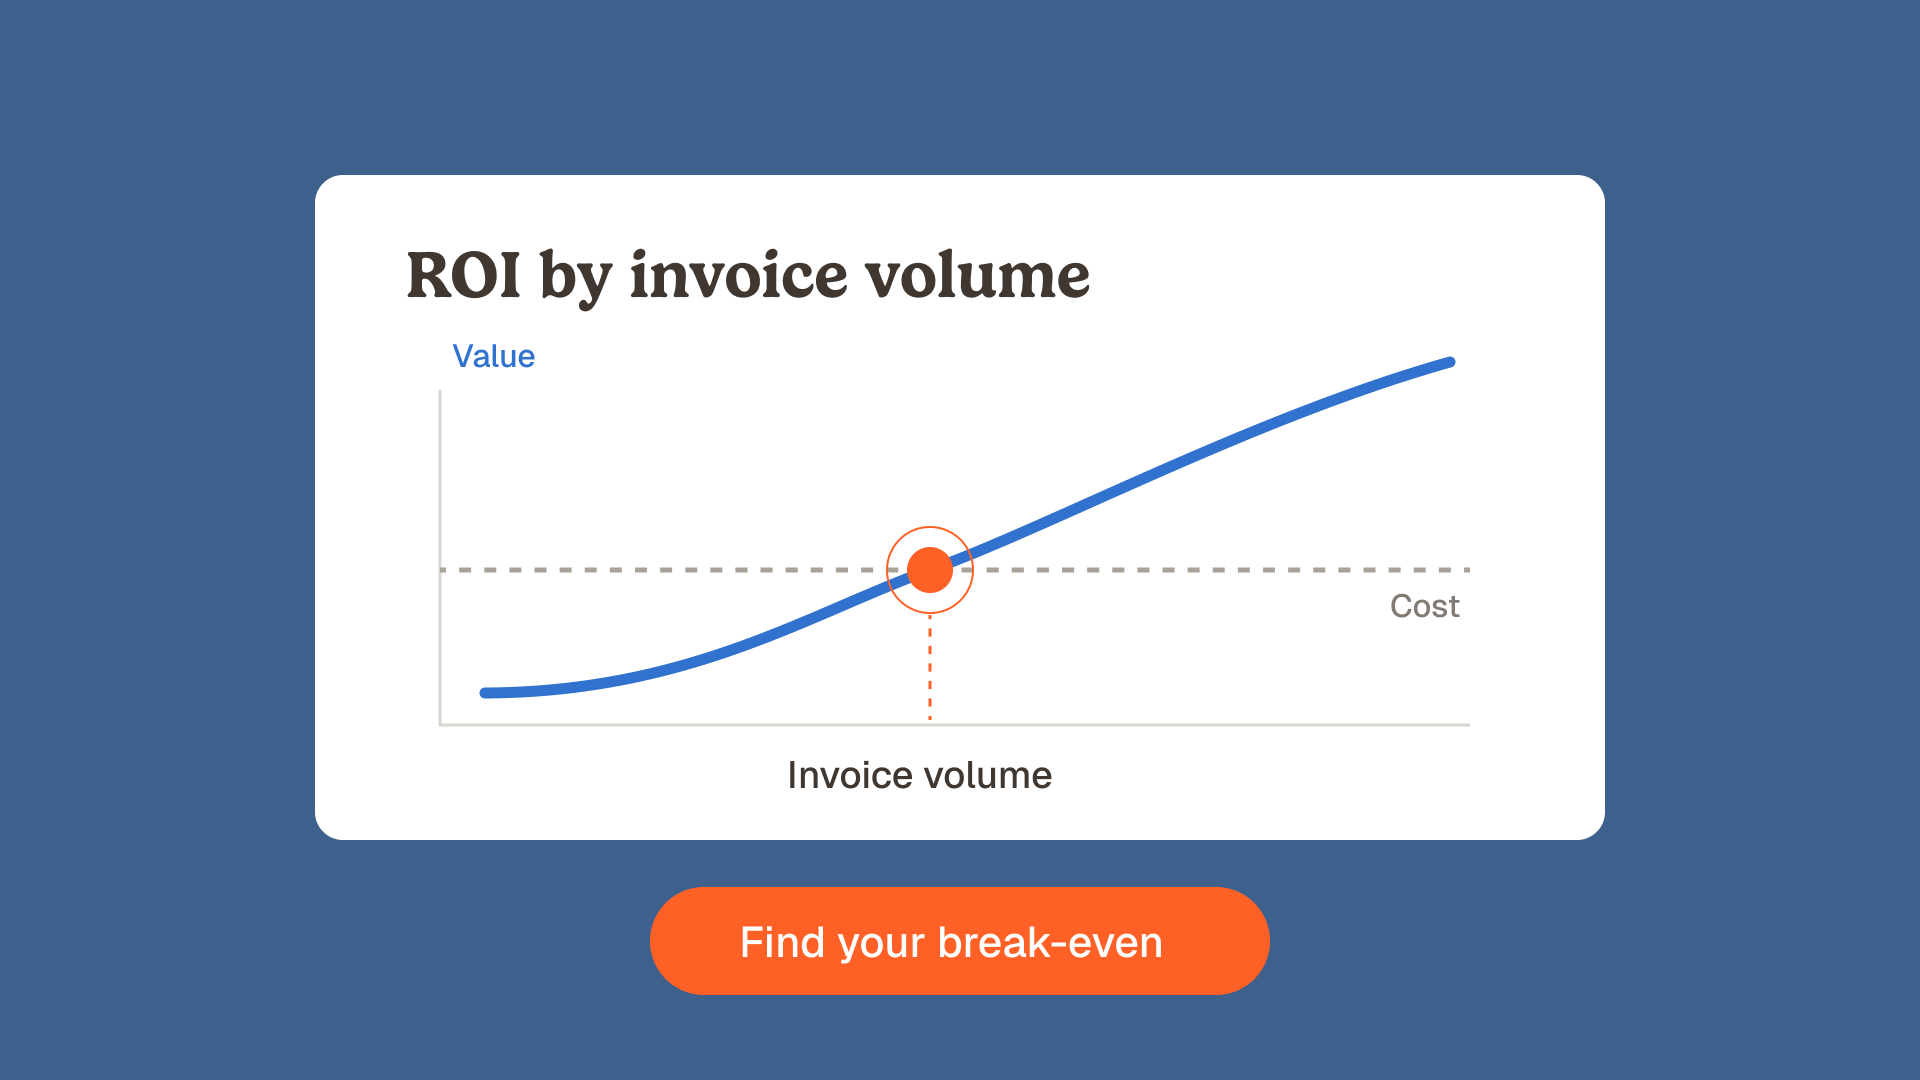
AP automation ROI is a division, and the number sitting underneath it is your annual invoice volume. At the cross-industry median cost of $5.83 to process one supplier invoice, a $299 per month licence starts covering itself on labour alone somewhere between 930 and 1,870 invoices a year, depending on how many of them clear without a human touch. In distribution and transport, where the median cost per invoice is $1.14, the same licence needs between 4,800 and 9,500 invoices a year to reach the same point. Below your own break-even volume, the labour saving does not pay for the subscription, and the return has to come from the errors the control catches before payment instead.
Key takeaways
- The cross-industry median cost to process one supplier invoice is $5.83, with the bottom quartile at $10 or more and the top quartile at $2.07 or less, according to APQC benchmarking data.
- Cost per invoice varies by a factor of eight between industries at the median: $1.14 in distribution and transport, $4.58 in consumer packaged goods, $9.43 in the public sector.
- A $299 per month licence breaks even on labour alone near 930 invoices a year if every invoice is touchless, and near 1,870 a year if half of them still need a person.
- Gartner's benchmark for a successful deployment is a touchless rate above 50%, so any model that assumes every invoice runs untouched overstates the labour saving by roughly half.
- Below the break-even volume the return comes from what gets caught before payment: at Astotel, price control on a single supplier recovered 400 euros a month, close to 4,800 euros a year.
What AP automation ROI actually measures
AP automation ROI is a ratio that compares the annual cost your finance team stops paying against the annual cost of the software that replaced it. The formula is uncontroversial and every vendor publishes the same one: net annual saving divided by total annual cost, times one hundred.
What makes the answer swing is not the formula. It is the two inputs almost nobody states out loud: what one invoice costs you today, and how many of them you handle in a year. Change either and the same software goes from an obvious purchase to an expensive one. That is why a single worked example, the format the market has settled on, tells you almost nothing about your own situation.
The baseline in most ROI models is not a benchmark
Most published models open on a manual cost of 12 to 15 dollars per invoice. Google's own AI Overview for this query, captured on 20 September 2026, builds its worked example on $15 per invoice falling to $3.
That number is not measured, it is inherited. The study cited by one of the pages Google ranks on the same query, Ardent Partners via Hyland, puts the average cost to process an invoice at $9.40, with best-in-class departments at $2.78, a gap of $6.62. And the reference most often ignored, APQC's Open Standards Benchmarking, puts the median at $6.00. When CFO.com detailed the same APQC measure, the median stood at $5.83, the bottom quartile at $10 or more, and the top quartile at $2.07 or less.
So the figure that anchors the market's arithmetic sits above the least efficient quartile of the real distribution. If your starting point is inflated, every downstream number is, and the ROI you were shown describes a company that spends more than three quarters of its peers.
It is worth being precise about what that unit cost contains, because the label hides a lot. The Ardent Partners figure covers labour, overhead, technology and the rest, not just the time somebody spends keying a document. That matters, because overhead and technology do not fall when you add software. Only the labour portion moves, and only for the invoices that actually stop being touched.
The same study makes the point from the other side. Best-in-class departments turn an invoice around in 3.1 days, against 17.4 days for everyone else, an increase of 461%. That is a very large operational gap sitting behind a per-invoice cost gap of $6.62. Speed and unit cost are not the same variable, and a business that is already fast has, by construction, less unit cost left to remove.
Cost per invoice varies by a factor of eight between industries
The median is not a target either, because the spread underneath it is enormous. On the same APQC data, the cost to process one invoice at the median of each industry ranges from $1.14 to $9.43.
| Industry, at the median | Cost to process one invoice | Position vs cross-industry median |
|---|---|---|
| Distribution and transport | $1.14 | Best performing |
| Consumer products and packaged goods | $4.58 | Below the median |
| Cross-industry median | $5.83 | Reference point |
| Public sector and government | $9.43 | Third quartile |
| Bottom quartile, all industries | $10.00 or more | Least efficient 25% |
| Top quartile, all industries | $2.07 or less | Best performing 25% |
Source: APQC benchmarking data, as detailed by CFO.com. The consequence is blunt. A goods-heavy business already running a lean AP function has less labour cost to remove than a slower organisation does, so it needs several times the invoice volume to justify the same licence. The efficiency you already built works against the business case for buying efficiency.
The break-even volume, segment by segment
Put the two inputs together and the threshold becomes computable. The table below divides an annual licence of $3,588 (a Studio plan at $299 per month) by the labour saved per invoice, using the reduction the market itself publishes: automated AP costs run at roughly a third of manual costs, so about 66% of the unit cost comes out.
| Your starting cost per invoice | Break-even if every invoice is touchless | Break-even at a 50% touchless rate |
|---|---|---|
| $10.00 (bottom quartile) | 544 invoices a year, 45 a month | 1,087 a year, 91 a month |
| $9.43 (public sector) | 576 a year, 48 a month | 1,153 a year, 96 a month |
| $5.83 (cross-industry median) | 932 a year, 78 a month | 1,865 a year, 155 a month |
| $4.58 (consumer packaged goods) | 1,187 a year, 99 a month | 2,374 a year, 198 a month |
| $2.07 (top quartile) | 2,626 a year, 219 a month | 5,253 a year, 438 a month |
| $1.14 (distribution and transport) | 4,769 a year, 397 a month | 9,537 a year, 795 a month |
Calculation made on 20 September 2026 from public figures: APQC cost per invoice, a 66% unit reduction, and a published licence price. The point is not the precision of any single row, it is the range. The volume at which AP automation pays for itself on labour alone moves from roughly 930 to roughly 9,500 invoices a year depending on where you start. A calculator that asks for your volume and not for your current cost per invoice cannot land anywhere near the right answer.
Two numbers decide whether you are above or below your own line: what you pay today to handle one invoice, and what the licence costs. The pricing page gives you the second one in about thirty seconds.
This is also why the calculators do not settle it. Three of the nine relevant results Google returns for this query are vendor ROI calculators. Every one of them asks for your invoice volume, and none asks what an invoice costs you today. They substitute their own baseline, which is the number the section above showed to be inflated, and then hand back a percentage that looks specific because your volume went into it.
Google's own generative layer behaves the same way. Its AI Overview for this query, captured on 20 September 2026, ends by offering to compute a custom ROI and asking the reader to pick a band: under 5,000 invoices, 5,000 to 20,000, or over 20,000. The French equivalent closes by asking for the monthly invoice volume. Two markets, two languages, and in both cases the machine stops and asks for the one number none of the published models will commit to.
Why the touchless rate halves the saving
The right-hand column of that table is not pessimism, it is the industry's own success criterion. Symtrax reports Gartner's benchmark targets for a successful deployment as a touchless processing rate above 50% and a capture-to-pay cycle under seven days. Half the invoices still passing through a person is what winning looks like.
Symtrax, an AP software vendor, is unusually direct about what that does to the arithmetic. Writing on 17 September 2026, it asks "why do most AP automation ROI numbers seem inflated?" and answers: "most vendor models assume 100% of saved employee time immediately converts into recovered cash. Realistic models only count savings that directly offset overhead, prevent hiring, or capture discounts."
That is the quiet condition attached to every labour saving. Ninety minutes a day freed across a two-person team is not cash until a hire is cancelled or a role is redeployed. In a team of two it usually is not, which is exactly the situation most businesses below the break-even volume are in.
What pays below the threshold: what gets caught before payment
If the labour case does not clear the bar at your volume, the purchase is not automatically wrong. It means the return has to come from the other side of the ledger, which is money that would otherwise have left the building.
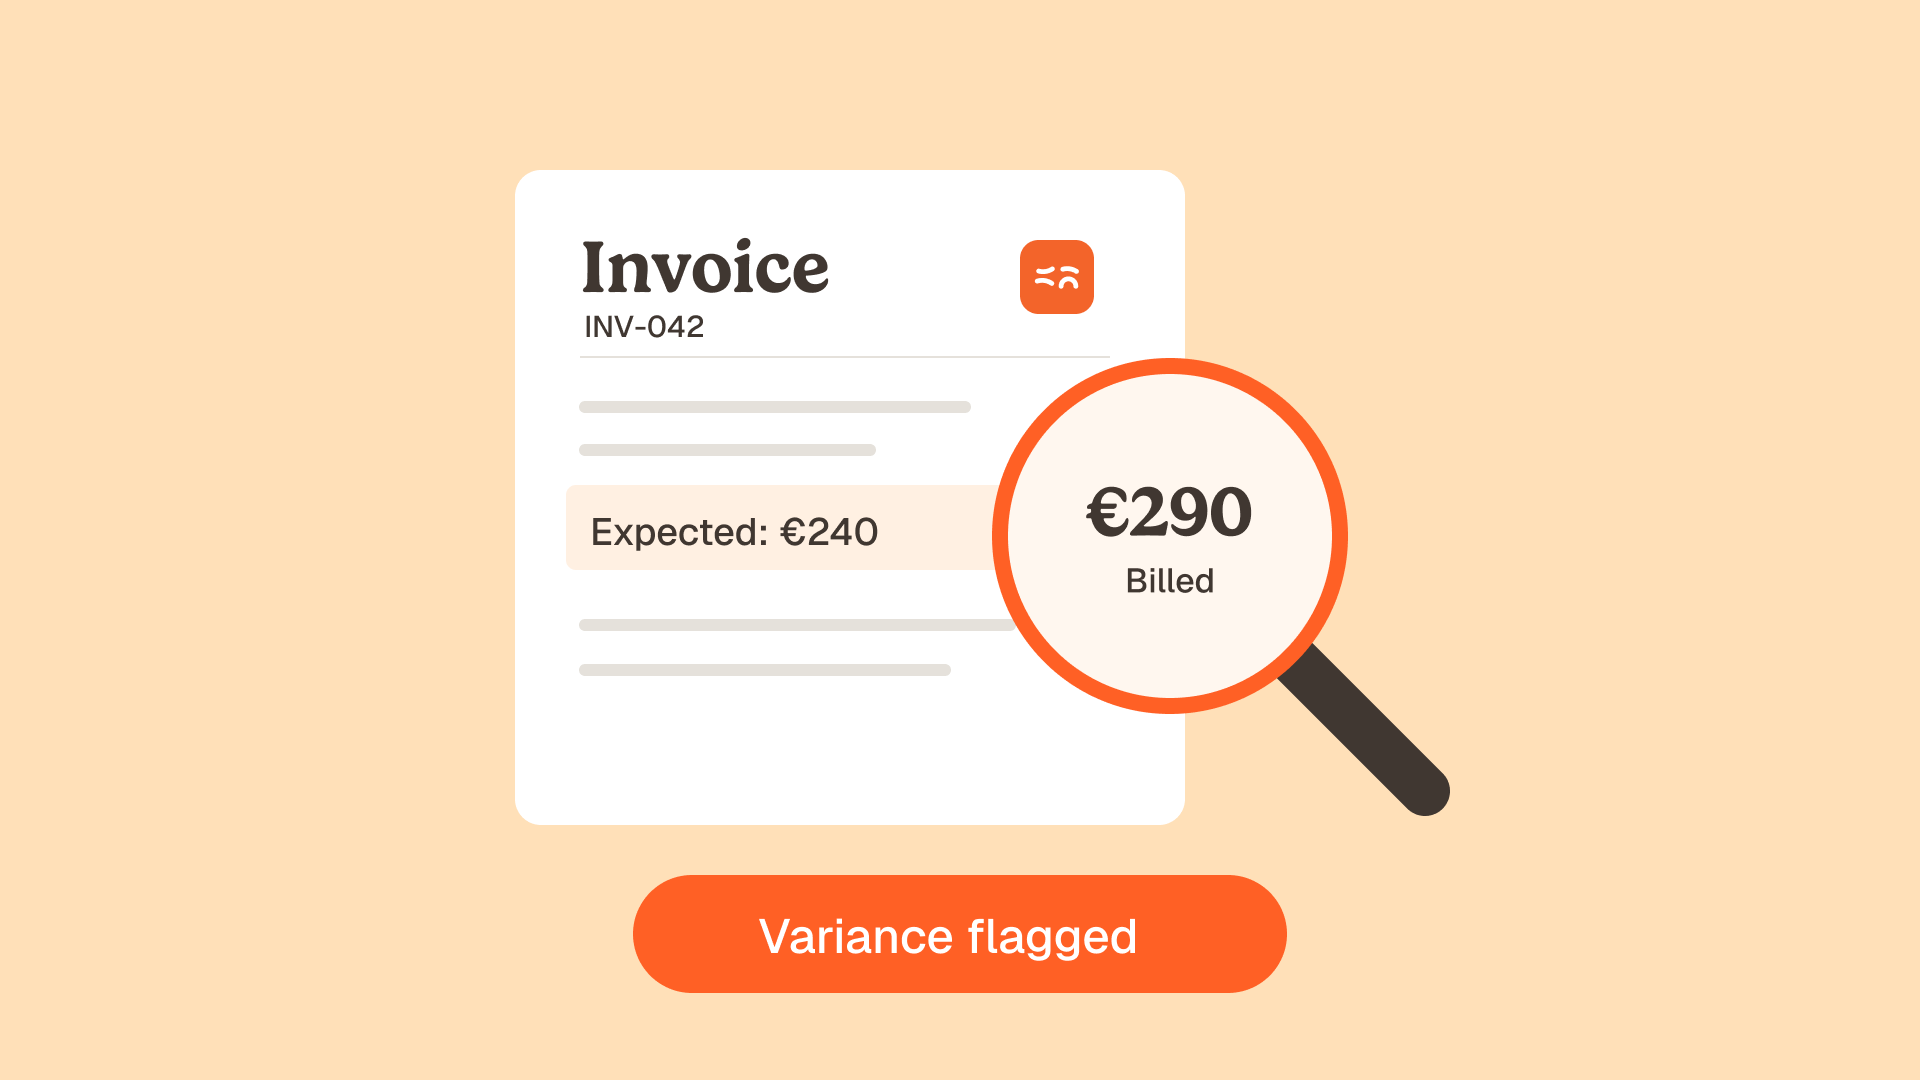
At Astotel, a group of 18 Paris hotels, price control against negotiated rates surfaced up to 400 euros a month of billing errors on a single supplier, close to 4,800 euros a year. That one supplier alone recovers more than the annual licence in the table above. Valerie, the group's purchasing director, puts it plainly: "I spot errors I would never have seen on my own."
This is a different unit of value, and it scales with supplier count and price volatility rather than with invoice count. A business with 700 invoices a month and forty suppliers on negotiated price lists has a weak labour case and a strong control case. The mechanics are the same ones behind three-way matching: compare each invoice line against the order and the goods receipt, and raise what does not agree before the payment run rather than after it.
It is worth noting how absent this is from the market's ROI writing. Across the six editorial pages ranking for this query, credit note, goods receipt and price variance appear zero times. The recovery side of the return is simply not modelled.
Two costs that belong in the model and rarely are
Exception handling is the first. Invoices without a purchase order cannot be matched automatically, and they are not a rounding error: the Institute of Finance and Management puts them at roughly 47% of enterprise invoices. Those invoices keep their full manual cost after go-live, so a model that applies the automated unit cost to the whole volume is describing a population that does not exist.
Supplier onboarding and change management is the second. Getting suppliers onto a channel, cleaning the vendor master, and retraining approvers all consume finance time in the first year, and none of it appears in a subscription price. The honest version of the model carries a first-year cost that is higher than the steady-state one, which pushes the break-even volume up in year one and down afterwards.
How to size it for your own volume in ten minutes
- Count, do not estimate. Pull the number of supplier invoices booked last year from your ERP. One query, one number.
- Work out your real cost per invoice. Take the fully loaded annual cost of everyone who touches supplier invoices, add the tools they use, divide by that volume. Compare it against the $5.83 median rather than against a vendor's slide.
- Split the volume. Separate invoices backed by a purchase order from those that are not. Only the first group can realistically go touchless.
- Apply 66% to the first group only. That is your defensible labour saving. Leave the rest at full cost.
- Ask what the saved time becomes. If no hire is cancelled and no role changes, write the labour saving down to zero and judge the purchase on recovery alone.
- Price the recovery side. Take your top ten suppliers on negotiated prices, sample three months of invoices against the agreed rates, and extrapolate. Most finance teams have never run this check, which is why the number surprises them.
Run in that order, the exercise usually produces one of two clean answers. Either your volume clears the labour threshold and the case is straightforward, or it does not and the decision turns on whether the control catches more than the licence costs. Both are defensible in front of a board. A 212% ROI built on someone else's baseline is not.
FAQ
How much does AP automation software cost?
Published subscriptions for small and mid-sized finance teams generally start between $200 and $500 a month for a single user, with usage-based credits on top. Add first-year implementation, supplier onboarding and integration work, which are rarely quoted upfront. Compare the annual total against your invoice volume, not against a headline monthly price.
What is a good ROI for AP automation?
Vendors typically quote 100% to 400% over three years, but that range is built on a manual baseline of 12 to 15 dollars per invoice, well above the APQC median of around $6.00. Recompute it with your own cost per invoice and your own volume before treating any published percentage as applicable.
What is the best KPI for accounts payable?
Cost per invoice processed is the most useful single measure, because it is benchmarked externally and it combines labour, technology and overhead. Pair it with the touchless rate and the percentage of invoices processed error-free the first time. Cycle time alone rewards speed without telling you whether the checks happened.
Will AI take over accounts payable?
No, and the economics above explain why. Roughly half of invoices still need a person under a successful deployment, and exceptions are precisely the cases where judgement matters. Phacet's AI agents run the comparisons and raise what disagrees, with the reasoning shown and an audit trail behind it, while the decision stays with the team.
How long does AP automation take to pay back?
Payback follows directly from your volume. Above the break-even line in the table above, first-year payback is realistic once implementation is absorbed. Below it, payback on labour alone may never arrive, and the honest question becomes how much error recovery the control produces in a year against the licence.
Last updated: 20 September 2026. Cost per invoice figures verified against APQC benchmarking data and CFO.com on that date.