
How can finance teams detect spend anomalies before they impact margins?
Published on :
March 16, 2026


Nicolas Marchais is co-founder and CEO of Phacet. After seven years at Spendesk, he built Phacet as the agentic layer that orchestrates across ERP, banking and email systems. Reliable, auditable, cross-system, what he calls a Finance Workforce.


Spend anomalies do not announce themselves. They accumulate quietly across billing cycles, a supplier invoicing 2% above the contracted rate every week, a duplicate invoice submitted to two subsidiaries in the same month, a product category where spend is trending 8% above forecast without any operational explanation. By the time any of these patterns appear in a management report, they have already compounded over weeks or months. The margin impact is not a future risk. It has already happened.
Finance teams that detect spend anomalies before they reach the P&L do not do it by reviewing monthly variance reports more carefully. They do it by moving the detection point upstream, from reporting, where anomalies are visible in aggregate after the fact, to the transaction layer, where each invoice is a data point that either conforms to expected patterns or deviates from them in a way that signals a problem.
The difference between detecting a spend anomaly at invoice level and detecting it at P&L level is the difference between preventing a cost and explaining one. At invoice level, the anomaly can be resolved before payment is made and before the cost enters the ledger. At P&L level, the cost is already committed, the cash has already moved, and the management conversation is about variance explanation rather than cost recovery.
This article explains the five categories of spend anomaly that cost organisations the most, why standard AP and reporting processes miss them systematically, and how finance teams have built detection that operates at the transaction level, catching deviations before they compound into margin impact.
The detection lag problem: why monthly reporting misses spend anomalies
The fundamental limitation of spend anomaly detection based on monthly management reporting is not the quality of the reports. It is the time lag between when an anomaly enters the spend base and when it becomes visible in aggregate data.
The compounding window
A billing deviation that enters the invoice population in week one and is detected in the monthly review at the end of week four has had three to four weeks to compound. If the same supplier invoices weekly, the anomaly has already appeared in three or four separate invoices, each adding to the accumulated overcharge. By the time the finance team flags the deviation in the monthly review, resolving it requires disputing multiple invoices, reopening payments already processed, and recovering funds that have already cleared.
Detecting the same deviation in the first invoice it appears in, before the payment is approved, costs one resolution conversation with the supplier. Detecting it at month-end costs three or four, plus the recovery effort for the amounts already paid. The detection lag does not just delay the resolution. It multiplies its cost.
The aggregation problem
Monthly reports aggregate spend into category totals and supplier-level summaries. Aggregation is useful for trend analysis and budget tracking, but it masks the transaction-level signals that indicate anomalies. A supplier whose total monthly invoice is within 1% of the prior month's total may still be billing individual line items at rates that deviate from the contracted price, with some lines above the reference and some below, netting to an acceptable aggregate figure.
Spend anomaly detection that operates on aggregated data will miss these within-account line-level deviations. The only detection method that catches them reliably is one that runs at the individual invoice line level, comparing each unit price against the applicable reference, on every invoice, at the time of receipt. This is what pre-decision control at invoice level means in practice: anomaly detection runs before aggregation happens, at the granularity where deviations are visible.
The context collapse problem
A €50 overcharge on a single invoice is unremarkable in isolation. The same supplier generating a €50 overcharge on every invoice across ten locations every week is producing €26,000 per year in excess billing, a meaningful anomaly that justifies a supplier conversation and potentially a contract renegotiation. The difference between these two interpretations is not the invoice data itself. It is the context: the frequency of the deviation, the number of sites affected, and the cumulative financial impact over time.
Monthly reports provide some of this context, but they require manual interpretation to connect individual transaction patterns to cumulative impact. An automated anomaly detection layer provides this context continuously and automatically, flagging not just that a deviation occurred, but how often it has occurred, across how many sites, and what the aggregate financial exposure amounts to.
The 5 categories of spend anomaly that cost the most
Spend anomalies fall into five distinct categories, each with a different detection mechanism, a different resolution path, and a different cumulative cost profile if left undetected.
1. Price compliance deviations
The most common and most financially impactful spend anomaly category is the billing price that does not match the contracted or reference rate. This includes invoiced unit prices above the agreed contract rate, mercuriale rates applied from the wrong week's price list, volume discount tiers not reflected in the invoice, and promotional pricing that expires but continues to be applied by the buyer's billing system as if it had not.
Price compliance deviations are the category where the detection lag matters most, because they are recurring by nature. A supplier who overbills at a 3% rate does not do it once, they do it on every invoice until someone catches and corrects the billing configuration. Every billing cycle that passes without detection adds another layer to the cumulative overcharge. Vivason identified €180,000 in annual overcharges attributable to price compliance deviations that had been accumulating undetected, not because the deviations were individually large, but because they had been recurring across a high-volume invoice base without systematic detection. The supplier billing control agent that Phacet deploys for this category applies price compliance checks on every invoice line at the moment of receipt, comparing invoiced prices to the applicable reference and flagging deviations before routing.
2. Quantity anomalies
Quantity anomalies occur when the number of units billed does not match the number of units delivered or ordered. In product-purchasing businesses, this includes invoiced quantities exceeding delivery confirmation records, billing for a full unit when a partial delivery occurred, and quantity rounding that consistently resolves in the supplier's favour.
Detection requires cross-referencing invoice quantities against delivery data, the second leg of 3-way matching. Where delivery confirmation records are reliable, this check runs automatically. Where they are partial or informal, as is common in food service environments where delivery notes are handwritten and signed under time pressure, the detection relies on pattern analysis: a supplier whose invoiced quantities consistently exceed delivery confirmations by a small percentage is exhibiting a systematic pattern that merits investigation regardless of whether each individual discrepancy exceeds the review threshold.
3. Cross-entity duplicate submissions
In multi-entity structures, the same invoice submitted to two subsidiaries is the spend anomaly category with the highest cost-per-instance. A duplicate invoice for €15,000 submitted to two entities and paid by both produces a €15,000 overcharge in a single transaction, not through accumulated small deviations but through a single control failure.
Cross-entity duplicates are invisible to any AP process that operates at the entity level, because each entity's system sees only one invoice. Detection requires a control layer with visibility across the full group invoice population simultaneously, the same layer described in our article on multi-site finance control. The detection check is straightforward: same supplier, same invoice number, same amount, appearing in more than one entity's invoice population within the same billing period. Simple in logic; impossible to execute manually when entities process invoices independently.
4. Pattern anomalies: behavioural shifts in supplier billing
Pattern anomalies are deviations from a supplier's own historical billing behaviour that do not necessarily violate a contracted rate but signal something worth investigating. A supplier who has consistently billed at €8.50/unit for eighteen months and suddenly bills at €9.10/unit has not necessarily overbilled, prices change legitimately, but the deviation from their own billing history merits a check against the current applicable reference.
Pattern anomalies are the category that requires time-series data to detect. A single invoice is a data point; a sequence of invoices from the same supplier is a behavioural baseline. Automated anomaly detection that builds and queries this baseline identifies pattern shifts as they occur rather than after they have established a new normal. Jinchan Group's 5x increase in anomaly detection after implementing systematic invoice-level validation reflects this: once the full invoice history became visible in a structured, comparable format, patterns that had been invisible in fragmented manual review became immediately apparent. See the full Jinchan case study for the operational context.
5. Entity misallocation and shadow spend
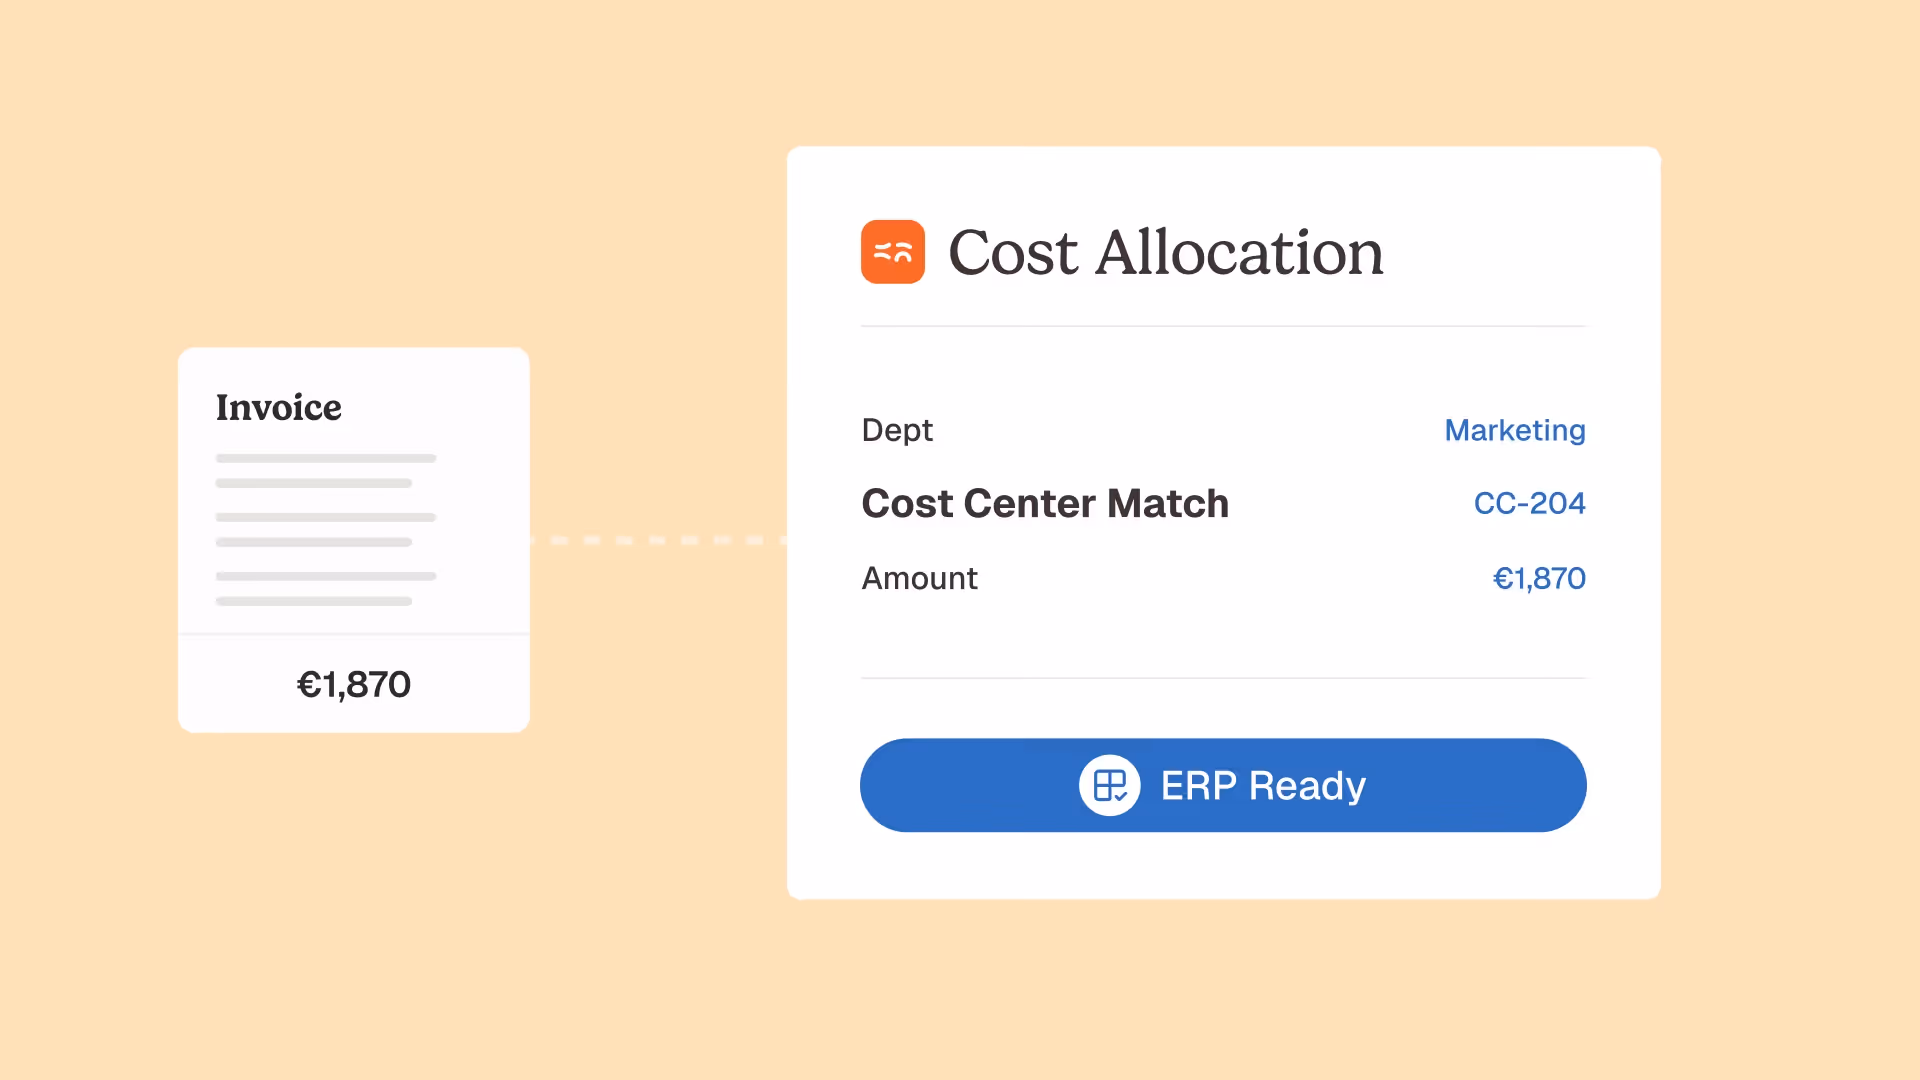
Entity misallocation anomalies occur when invoices are assigned to the wrong cost centre, subsidiary, or GL account, not because of billing fraud, but because routing decisions made under time pressure by site managers or shared service teams apply incorrect business rules. The financial impact is not an overcharge but a distortion: costs appear in the wrong entity's accounts, distorting entity-level P&L and consolidation accuracy.
Shadow spend, purchases made outside the approved supplier base, often routed through personal expense claims or informal supplier relationships at site level, appears as anomalous spend in categories where the approved supplier exists and should be generating the invoices. Detection requires comparing actual invoicing sources against the approved supplier list and flagging invoices from unapproved sources in categories where a contracted alternative exists.
Building spend anomaly detection that operates before margin impact
The architecture for spend anomaly detection that catches deviations before they reach the P&L has three components: a real-time data layer, an anomaly classification engine, and a structured exception workflow that routes each anomaly type to the appropriate resolution path.
The real-time transaction data layer
Anomaly detection that runs on periodic batches of aggregated spend data produces the detection lag described above. Detection that runs on each invoice as it arrives eliminates the lag, the anomaly signal is generated at the point of document receipt, before any payment decision is made.
This requires a live connection to the invoice intake channel: every supplier email arriving in the accounting inbox is processed by the detection layer in real time, not batched for weekly or monthly analysis. Phacet's accounting inbox automation provides this live intake connection for multi-entity groups, capturing invoices from all sites and all suppliers as they arrive and feeding them immediately into the validation and anomaly detection sequence.
The data layer also needs historical context: to detect a pattern anomaly, the system needs the supplier's billing history across previous periods. To detect a cross-entity duplicate, it needs the current invoice population across all entities. To detect a price compliance deviation, it needs the current applicable reference rate for that supplier and product category. All of this context must be available at the moment of invoice receipt, not retrieved manually from separate systems after the fact.
The anomaly classification engine
Not every deviation from a reference price is an actionable anomaly. A 0.02% rounding difference on a low-value invoice line is noise. A 4% deviation from the contracted rate on a high-volume product line is a signal. The classification engine distinguishes between them by applying tolerance thresholds calibrated to each supplier category, deviation type, and cumulative impact potential.
Effective anomaly classification uses three dimensions simultaneously:
- Magnitude: the percentage and absolute value deviation from the reference price or expected quantity. Thresholds vary by category, 1% tolerance on a high-volume staple commodity, 3% on a volatile fresh produce item, 0% on a fixed-rate contracted service.
- Frequency: how often this deviation pattern has appeared in this supplier's billing history. A first occurrence triggers a soft flag and a reference check. A third occurrence in the same billing period triggers an escalation and a supplier notification.
- Cumulative exposure: the aggregate financial impact of this anomaly type across all invoices and all sites in the current period. A deviation that represents €40 on a single invoice but €8,000 at group level across all affected sites is classified at the group exposure level, not the individual invoice level.
Human-in-the-loop review applies to the exception output of this classification, the fraction of invoices where the classification engine identifies a signal that requires a human decision. Astotel's implementation produced a reduction from 7% to 2% in invoice error rate, with the remaining exceptions routed through a structured review process rather than surfacing as unstructured variance in the monthly accounts. The Astotel case study covers how the classification thresholds were calibrated for a multi-property hospitality portfolio with diverse supplier categories.
The exception workflow: from detection to resolution
Anomaly detection is operationally valuable only if the detected anomaly is routed to the right person, with the right context, in time to act before the cost is committed. An anomaly detection system that generates alerts and delivers them to a generic inbox is noise management, not spend control.
Effective exception workflows route each anomaly type to a differentiated resolution path:
- Price compliance deviations route to the AP reviewer with the invoiced price, the reference price, the variance amount, and the supplier contact for the billing correction request, all pre-populated in a structured exception record.
- Quantity anomalies route to the site manager who received the delivery, with the specific line items in question and the delivery note reference, for confirmation or correction before the invoice is processed.
- Cross-entity duplicates route to the group finance controller with both entity records visible, for a deduplication decision and a supplier dispute initiation if the duplicate was intentional.
- Pattern anomalies accumulate in a supplier behaviour record accessible to the procurement team, forming the evidential basis for the next contract review rather than triggering individual invoice disputes.
Every exception outcome is recorded in the audit trail, whether the anomaly was confirmed and resolved, dismissed as a false positive, or escalated for further investigation. This record is the data layer that makes the anomaly detection system self-improving: false positive rates are visible by category, thresholds are adjusted accordingly, and the classification accuracy improves over successive billing cycles.
Spend anomaly detection across multiple entities: the group intelligence advantage
The full value of systematic spend anomaly detection emerges at group level, where patterns visible only in aggregate data produce insights unavailable to any entity-level review process.
Cross-supplier benchmarking
When every supplier's billing is validated against the same reference framework and every deviation is recorded consistently, the anomaly data produces a comparative supplier performance view: which suppliers have the highest deviation frequencies, which categories produce the most systematic overcharges, and where the procurement team should focus its next renegotiation effort.
This cross-supplier intelligence is impossible to generate from manual review processes, which produce anecdotal observations rather than statistically reliable performance data. The supplier transaction labelling agent that Phacet deploys for margin tracking provides this comparative view as a continuous output of the validation process, classifying every validated transaction by supplier, category, and deviation status, and making the resulting performance data available for procurement decision-making.
Cross-site pattern correlation
A spend anomaly that appears at a single site may be an isolated incident. The same anomaly pattern appearing at multiple sites simultaneously is evidence of a systemic supplier billing issue, a billing system misconfiguration, a price list that was updated inconsistently, or a deliberate overbilling pattern targeting the group's distributed structure.
Detecting cross-site pattern correlation requires the group-level data visibility described in our multi-site finance control article. La Nouvelle Garde's finance team gained this visibility across 14 restaurant locations when centralised invoice validation replaced fragmented site-level processing, producing for the first time a coherent view of supplier billing behaviour across the full group rather than 14 independent snapshots. See the La Nouvelle Garde case study for the specific anomaly patterns that became visible at group level.
Predictive exposure modelling
Once anomaly detection has run for multiple billing cycles, the accumulated data supports forward-looking exposure estimates: if the current supplier billing deviation rate continues at its present frequency, what is the projected cumulative impact on margin over the next quarter? Which anomaly categories are trending upward, and which have been resolved through supplier corrections?
This predictive view is what separates spend anomaly detection as a CFO-level management tool from a transactional AP efficiency measure. The French Bastards' ability to maintain controlled margin performance through rapid physical expansion from 7 to 14 locations depended on this visibility: as new sites joined the invoice validation framework, their supplier billing behaviour became immediately visible in the group anomaly picture, allowing proactive supplier management rather than reactive variance explanation. Read the full French Bastards case study for the finance governance approach that supported this expansion.
FAQ
What is spend anomaly detection in finance?
Spend anomaly detection in finance refers to the systematic identification of supplier billing transactions that deviate from expected patterns, contracted prices, approved quantities, normal billing frequency, standard entity assignments, before those deviations are processed as committed costs. Effective spend anomaly detection operates at the invoice level, at the time of receipt, rather than on aggregated monthly reporting data, where anomalies are already embedded in the cost base before they become visible.
What types of spend anomalies are most financially impactful?
The most financially impactful anomaly categories, ranked by cumulative cost potential, are price compliance deviations (billing above contracted or reference rates, recurring across high-volume invoice populations), cross-entity duplicate submissions (same invoice paid by multiple subsidiaries), quantity anomalies (billing for goods not delivered), pattern anomalies (behavioural shifts in supplier billing that signal a systemic change), and entity misallocation (costs recorded against the wrong cost centre, distorting entity-level margin). Price compliance deviations are the highest-frequency category; cross-entity duplicates produce the highest cost-per-incident.
How does spend anomaly detection differ from monthly variance analysis?
Monthly variance analysis identifies where actual spend deviated from budget across a reporting period, it is retrospective and aggregated. Spend anomaly detection identifies where individual transactions deviate from expected billing patterns, it is prospective and transaction-level. The key operational difference is the detection lag: variance analysis detects an anomaly after it has compounded over the full reporting period, while transaction-level detection catches it at first occurrence, before payment is approved. The financial difference is the difference between cost prevention and cost explanation.
Can spend anomaly detection work without complete purchase order data?
Yes, though with reduced precision on the quantity anomaly detection dimension. Price compliance checking, cross-entity duplicate detection, and pattern anomaly detection all operate on invoice data alone, without requiring purchase order records. Quantity anomaly detection, the comparison of billed quantities to ordered or received quantities, requires delivery confirmation data to be reliable. In environments where purchase orders are informal or verbal, partial quantity anomaly detection is possible by identifying statistical outliers in quantity-per-invoice relative to the supplier's historical billing patterns.
How do you avoid false positives in spend anomaly detection?
False positive rates are controlled through tolerance threshold calibration by supplier category and deviation type. A 1% price tolerance threshold on a stable commodity product will generate few false positives; the same threshold on a fresh produce supplier operating on weekly mercuriales will generate many, because legitimate weekly price changes will exceed the threshold. Calibrating tolerance thresholds to the volatility characteristics of each supplier category, and adjusting them based on observed false positive rates during the first two to four weeks of live operation, brings most deployments to below a 5% false positive rate, meaning more than 95% of flagged anomalies represent genuine deviations warranting review.
How does spend anomaly detection connect to supplier contract management?
Systematic anomaly detection generates a supplier billing performance record, deviation frequency, anomaly categories, cumulative overcharge amounts, that directly informs contract management decisions. Suppliers with consistently high deviation rates are candidates for billing system audits and contract renegotiation. Categories with persistent anomaly patterns suggest that the contract terms need tighter specification of pricing mechanisms, quantity measurement, or entity assignment rules. The anomaly detection system produces the evidence base for commercial conversations that would otherwise rely on anecdotal dispute history.
What is the ROI of spend anomaly detection?
The ROI calculation has two components: recovered overcharges and averted future costs. Recovered overcharges are the direct financial impact of catching billing deviations before payment, or identifying patterns that justify supplier credit requests for amounts already paid. For organisations processing high invoice volumes from mercuriale-based or complex pricing suppliers, this component alone typically delivers a positive ROI within the first quarter of implementation. Averted future costs are the ongoing benefit of systematic detection preventing anomaly recurrence: once a supplier's billing system is corrected following a detected deviation, the recurring overcharge stops. For suppliers with annual billing volumes in the hundreds of thousands of euros, a single corrected billing configuration can eliminate tens of thousands in annual excess spend.
How long does it take to implement spend anomaly detection?
For most multi-site groups, a working anomaly detection system covering priority suppliers is operational within two to three weeks of deployment. This covers invoice intake connection, reference data loading for key suppliers, and initial threshold configuration. Full coverage calibration, tuning thresholds across all supplier categories to the target false positive rate, takes an additional two to four weeks of live operation with real invoice traffic. The full implementation timeline from initial connection to stable operation is typically four to six weeks, without requiring ERP changes or IT project involvement.
Detection before commitment: the finance team's leverage point
The moment of maximum leverage in spend control is the moment before a payment is approved, not the month-end review where anomalies appear as variance, not the audit where they surface as findings, but the precise instant when an invoice arrives and the decision to pay or dispute is still available.
That leverage point is only accessible to finance teams with detection that operates at transaction level, in real time, on every invoice in the population. Detection that runs on sampled data, on monthly aggregates, or on manual review of high-value invoices alone gives away the leverage that transaction-level detection preserves.
The companies that manage supplier spend most effectively do not have more reviewers or more sophisticated reporting tools. They have built the detection layer where it matters: at invoice receipt, before cost commitment, with anomaly classification that generates actionable signals rather than noise. Book a demo to see how Phacet's spend anomaly detection operates across your supplier base and entity structure, and what your current invoice population reveals when every transaction is checked rather than sampled.
Latest Resources

Unlock your AI potential
Go further with your financial workflows — with AI built around your needs.


